
From Mouse Videos to Measurable Behavior
A human-in-the-loop machine learning workflow for tracking two interacting mice, translating pose trajectories into behavioral features, and validating behavior predictions against corrected annotations.
- Organization
- Sternson Lab, UC San Diego
- Role
- Data Engineer Research Assistant
- Timeline
- June 2025 to Present
- Domain
- Behavioral Neuroscience
- Methods
- Pose EstimationFeature EngineeringClassificationError Analysis
Try it: can you identify an observation episode?
Working prototype from the Sternson Behavioral ML Explorer. Watch DEM/OBS, drag an interval, compare against corrected labels and synchronized features. Local browser state only — nothing uploads. Does not run SLEAP or XGBoost live.
At a glance
Annotated frames
8,200
Across three labeling batches
Keypoints tracked
4
Nose, left ear, right ear, tail base
Animals
2
DEM (demonstrator) + OBS (observer)
Mean ROC-AUC
0.85
Five-fold cross-validation
THE PROBLEM
Manual review of social behavior videos does not scale
Two mice share an arena: the demonstrator (DEM) already knows the food-reward task; the observer (OBS) watches and may learn. Hours of video cannot be scored frame-by-frame by hand, and animals overlap, occlude, and swap identities.
MY ROLE & ACTION
Human-in-the-loop pose tracking → features → classifier
- · Labeled 8,200 frames (nose, left ear, right ear, tail base) across three correction batches
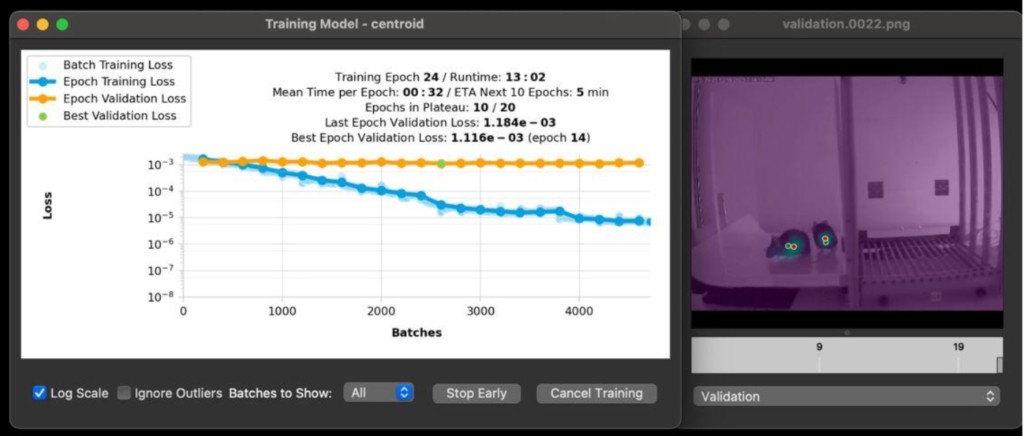
- · Trained SLEAP multi-animal top-down models; reviewed failures from occlusion and overlap
- · Engineered movement / distance / orientation / temporal features; aligned to corrected behavior intervals
- · Trained XGBoost; built raster + review tooling for error analysis (PyQt workflow + this web explorer)
THE RESULT
0.85 mean ROC-AUC with five-fold CV — plus inspectable failures
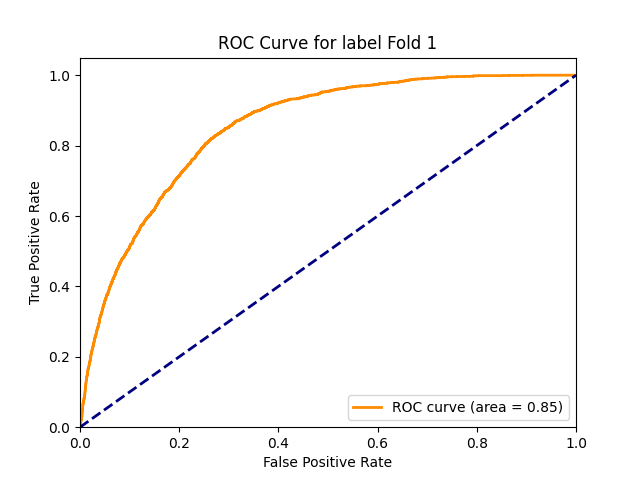
Aggregate ranking performance of 0.85 mean ROC-AUC across folds, with human-reviewed error cases. Analyses contributed to work presented at SfN 2025. The metric comes from the behavior-classification pipeline — not from the interactive demo alone.
End-to-end architecture
Keep these layers separate when you interview: pose ≠ behavior; features ≠ labels; ROC-AUC ≠ “the biology is solved.”
- 01
Behavioral video
Two mice · DEM + OBS · continuous recording
- 02
Manual keypoints
Nose, earL, earR, tail base · 8,200 frames
- 03
SLEAP pose models
Centroid → centered-instance · multi-animal
- 04
Human correction
Occlusion, overlap, identity · retrain loop
- 05
Pose trajectories
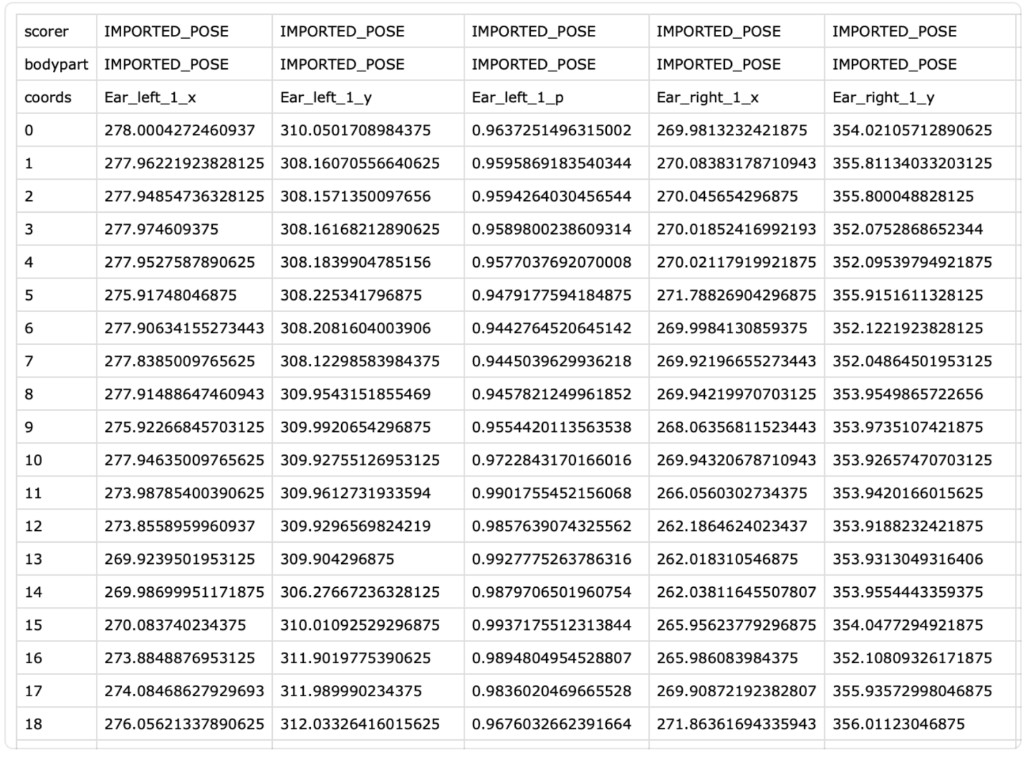
(x, y, confidence) per landmark per frame
- 06
Feature engineering
Velocity, distance, orientation, temporal
- 07
Behavior labels
Corrected intervals (not pose itself)
- 08
XGBoost classifier
0.85 mean ROC-AUC · 5-fold CV
- 09
Error analysis
Rasters + review GUI · failure modes
How the pipeline worked — visual walkthrough
Click each stage. Figures are cropped from lab tooling / analysis outputs — not full PDF pages dumped onto the site.
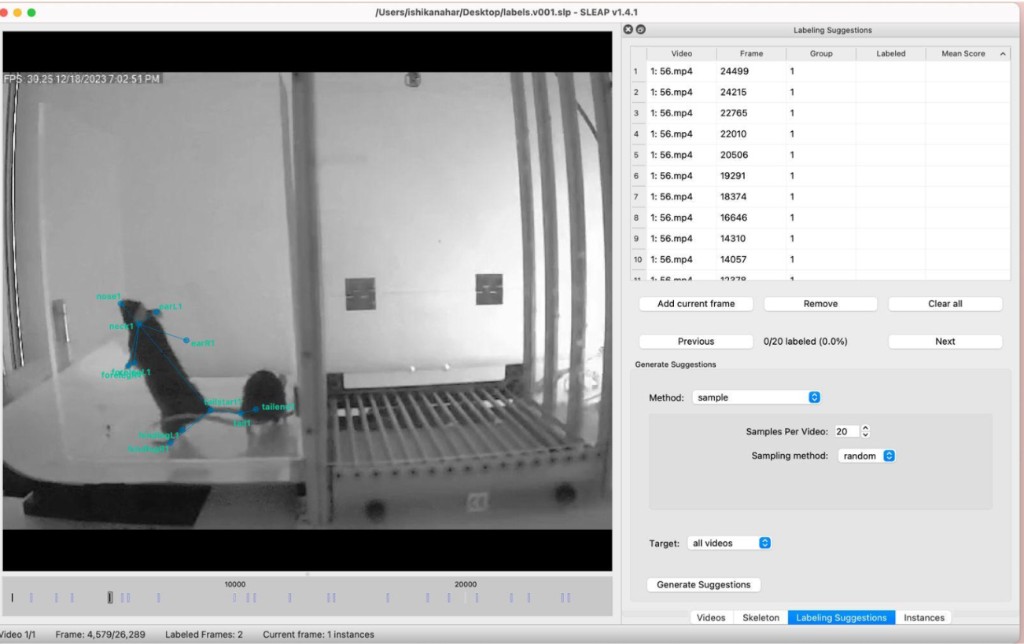
Label Keypoints
I loaded arena videos into SLEAP and manually placed nose, left ear, right ear, and tail base. Early batches favored clear anatomy; later batches targeted hard poses the model failed on. Each landmark is an (x, y) per frame — the ground truth for pose training.
Feature cards (what I actually engineered)
Velocity
How quickly each mouse changes position.
Nose-to-nose distance
Proximity between DEM and OBS.
Head direction
Orientation from nose–ear geometry.
Angular velocity
How quickly orientation changes.
Reward-location distance
Distance to the food / lick port.
Temporal windows
Rolling summaries across frames — behavior is not frame-independent.
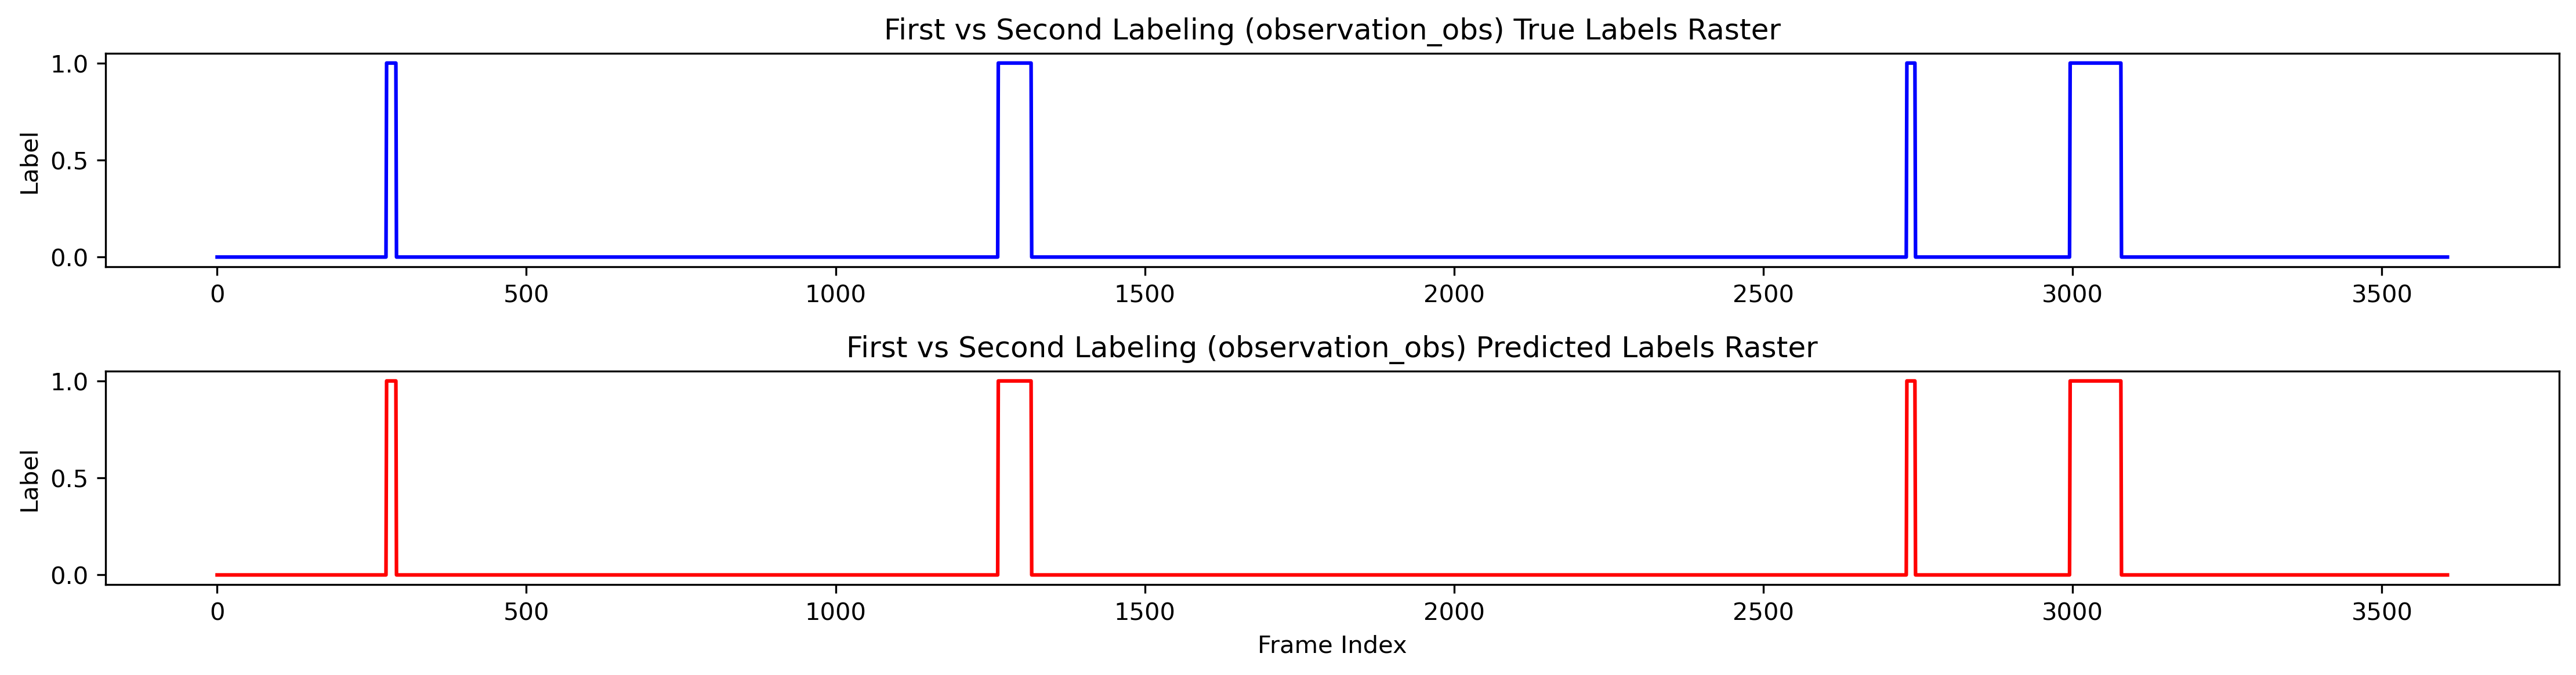
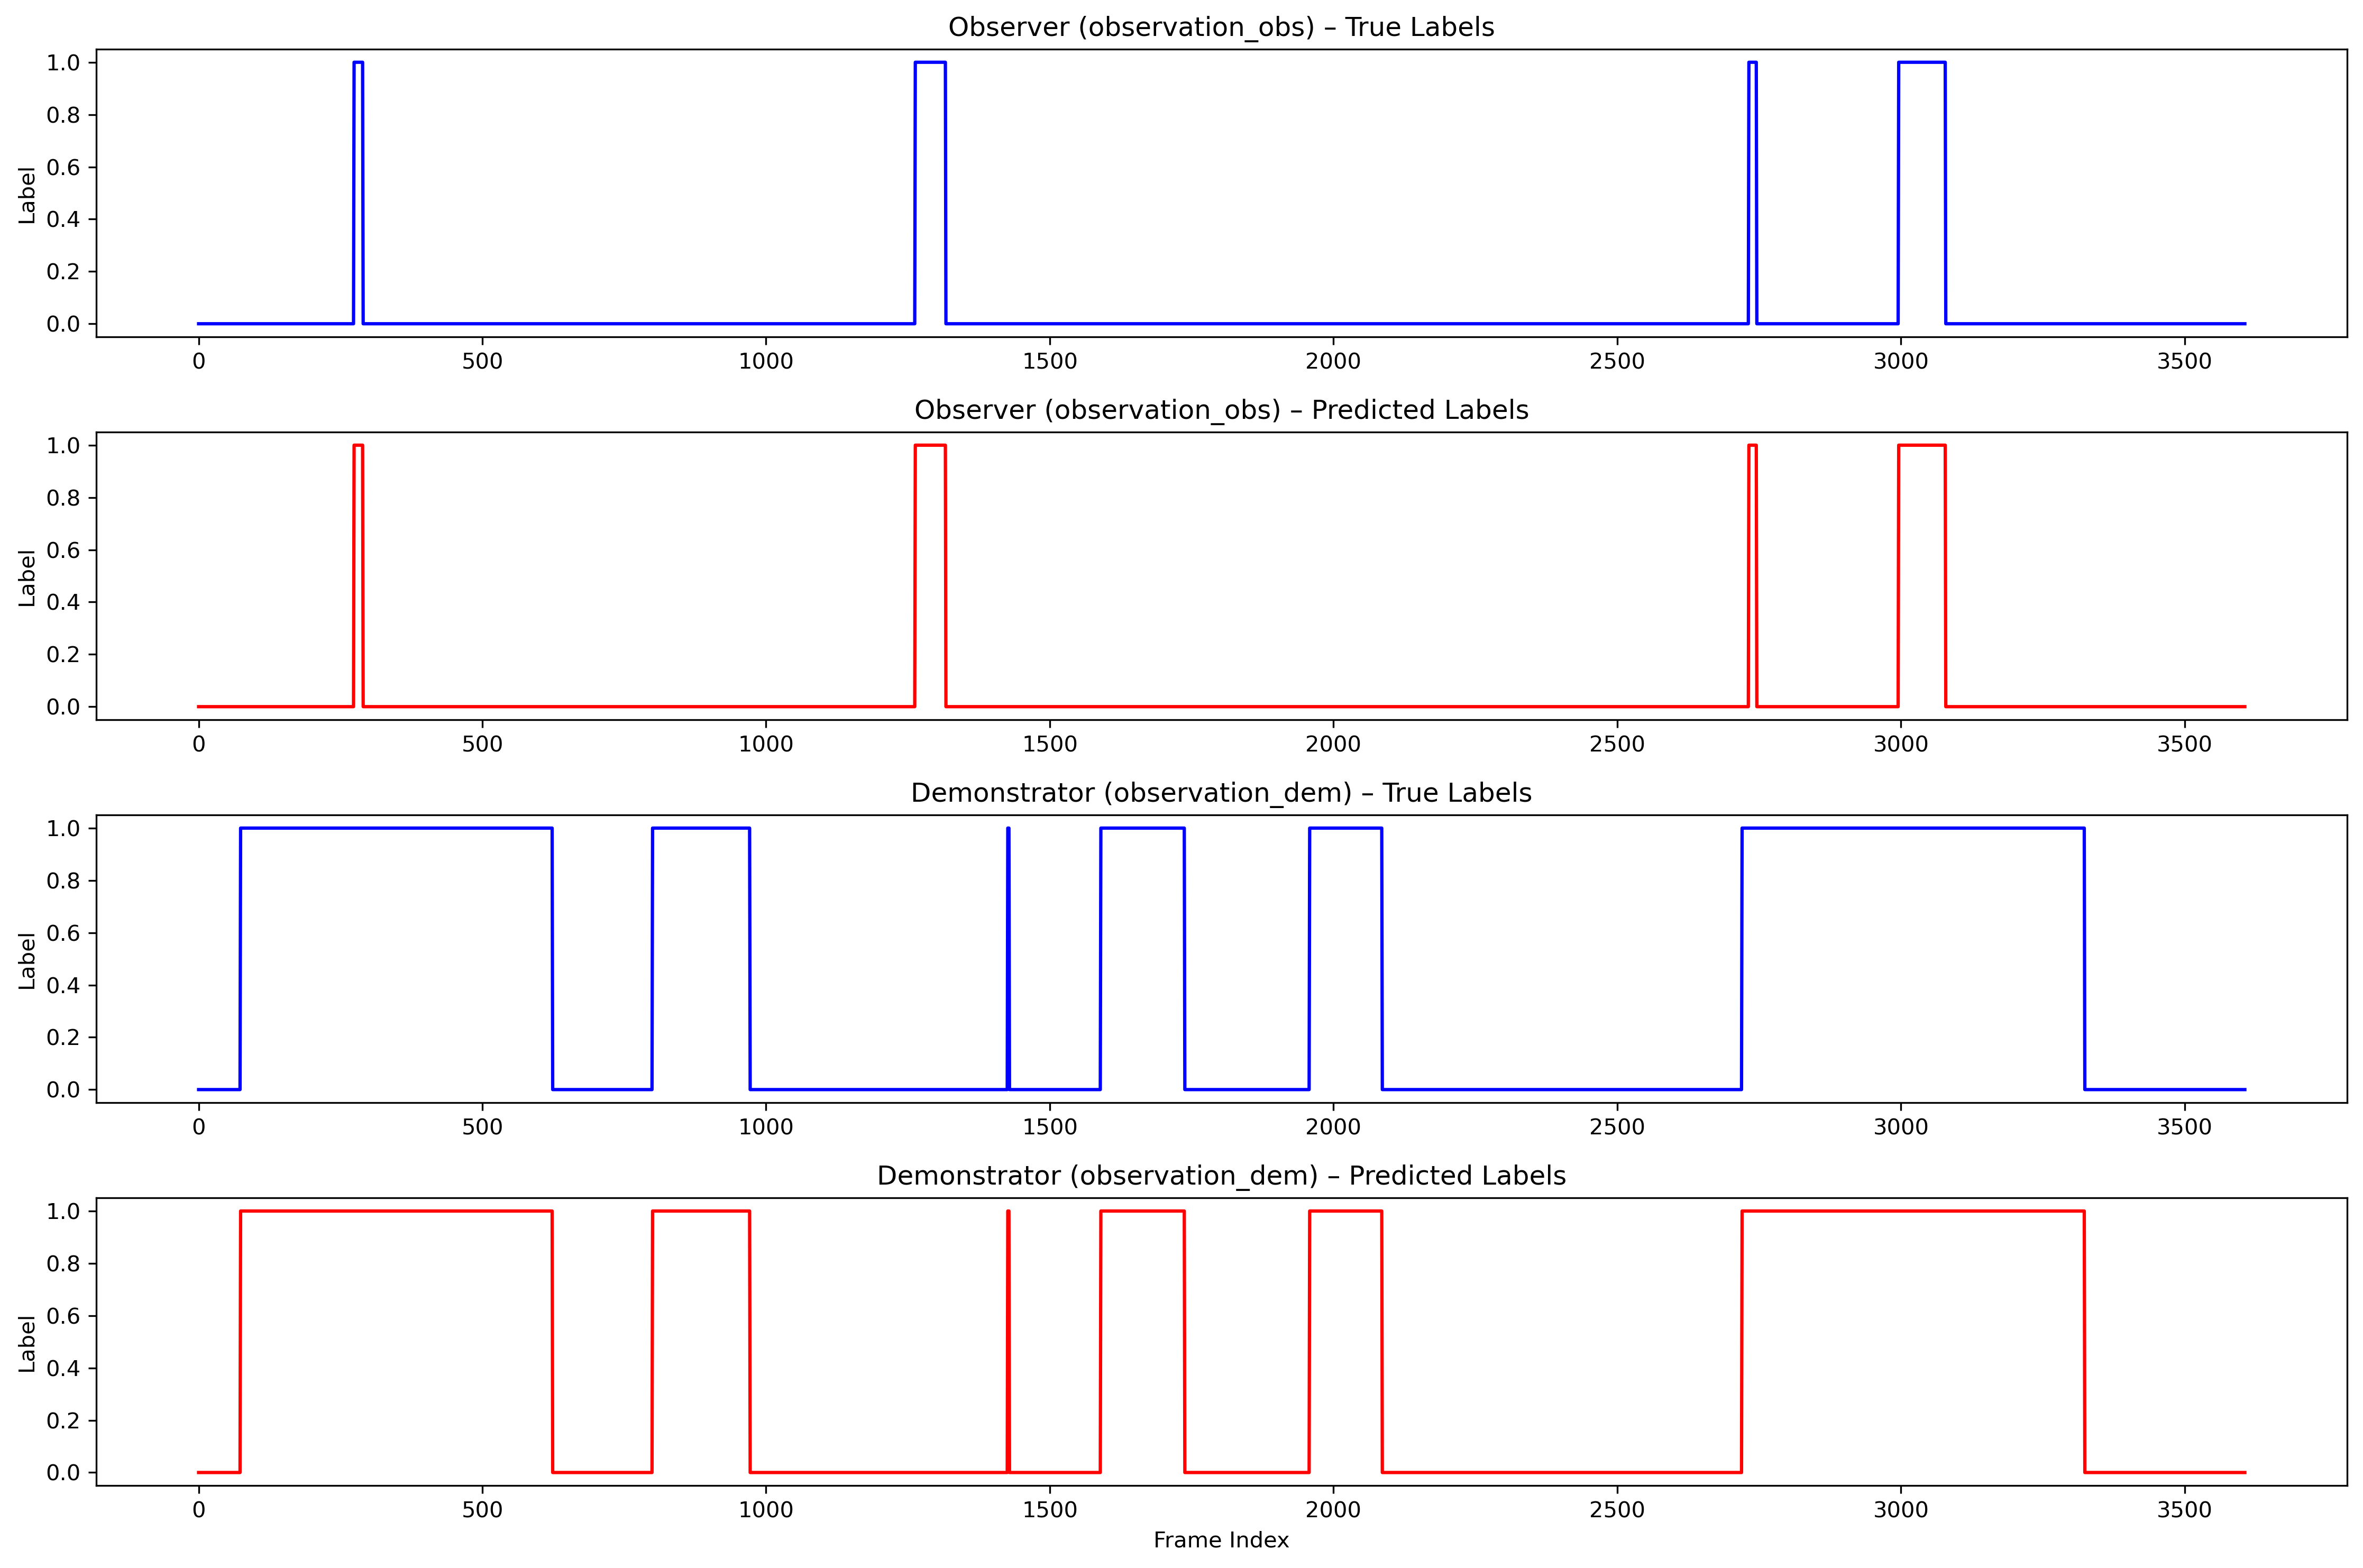
Error analysis is the point
For ML interviews: I do not stop at a single score. Rasters show where predictions fragment, over-fire, or miss — which is how I chose the next frames to label.
False positive
Model marks observation when animals are only crossing or approaching without a true bout.
Missed bout
True observation interval present in corrected labels but absent or shortened in predictions.
Fragmented bout
One continuous behavior is split into pieces when a few middle frames are missed.
Occlusion / identity
Overlap or unusual orientation drops confidence and can swap DEM/OBS tracks.
What I built
UC San Diego Neurobiology Lab · Data Engineer Research Assistant · June 2025 – Present. I contributed inside a larger laboratory pipeline for social observational learning — I did not design the neuroscience experiment myself.
- Built and iterated a computer-vision pipeline to quantify social learning: SLEAP multi-animal pose estimation on 8,200 manually annotated frames across 3 labeling batches, tracking 4 keypoints on 2 interacting mice while maintaining identity.
- Labeled nose, left ear, right ear, and tail base — starting with clear anatomy, then targeting overlap, occlusion, unusual orientation, and identity ambiguity.
- Diagnosed model failures frame-by-frame (false positives, missed bouts, fragmented intervals, low-confidence heatmaps) and used those cases to drive targeted re-labeling and retraining.
- Aligned pose trajectories with ELAN ground-truth behavioral intervals — matching timestamps/frame indices so engineered features and labels refer to the same moments in the video.
- Engineered movement, inter-animal distance, orientation, and temporal features; trained and evaluated XGBoost with F1 and ROC-AUC (0.85 mean ROC-AUC, five-fold CV); explored HMMs for temporal state structure.
- Tuned classifier hyperparameters (tree depth, learning rate, regularization / sample weights) and compared folds to see where performance collapsed rather than chasing a single score.
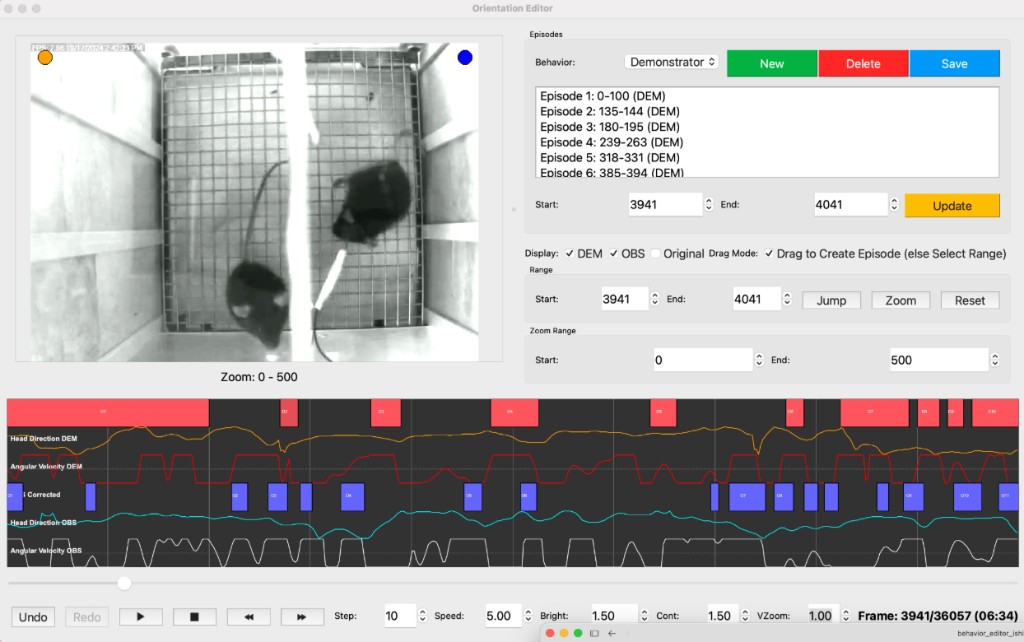
- Built Python raster visualizations and a PyQt Orientation Editor for human-in-the-loop review: video + DEM/OBS episode blocks + synchronized head-direction and angular-velocity traces.
- Contributed analyses presented at the 2025 Society for Neuroscience Annual Meeting.
Technical concepts
Expand any card for the definition, how it showed up in this pipeline, and what tends to break.
Why it mattered here
DEM and OBS share the same frame. Single-animal assumptions break when animals interact.
How I used it
SLEAP predicted four keypoints per mouse across frames after iterative human-in-the-loop labeling.
Technical detail
Labeled frames train a CNN that outputs per-body-part heatmaps; peaks become coordinates used for tracking.
What can go wrong
Overlap and identity ambiguity remain failure modes even after correction batches.
Results
- 8,200 annotated frames across three labeling batches
- Four anatomical landmarks across two animals
- 0.85 mean ROC-AUC with five-fold cross-validation
- Human-reviewed error cases involving occlusion, identity switches, and low-confidence predictions
- Interactive tools for reviewing behavioral episodes and temporal features
- Analyses contributed to work presented at SfN 2025
Limitations
- · Pose confidence decreases during occlusion.
- · Mouse overlap can cause identity ambiguity.
- · Manually corrected labels still involve human judgment.
- · Temporal dependence complicates frame-level evaluation.
- · ROC-AUC does not reveal every failure mode.
- · The public demonstration uses a short, precomputed sample — it does not run SLEAP or XGBoost live.
- · Laboratory footage and figures require approval before public use.
Accuracy distinctions (say these out loud in interviews)
- · SLEAP predicts pose keypoints — not behavior labels.
- · XGBoost predicts behavior from engineered features.
- · Corrected annotations are not the same as model predictions.
- · Feature–behavior association does not establish biological causality.
What I learned
This project changed how I think about model performance. A strong aggregate metric does not reveal where a system fails. Reviewing individual frames and behavioral episodes showed me why domain context and human validation remain essential when predictions are used to interpret complex biological behavior.